

Every year, benchmark reports land in fintech marketing inboxes, get bookmarked, screenshot, and quietly misinterpreted.
The numbers themselves aren’t the issue. The way they’re used is.
Comparing your CPL to an industry average and deciding you’re “on track” (or not) is how budgets drift into the wrong places. Benchmarks don’t tell you if your marketing is working. They tell you how a channel behaves, where friction sits, where costs creep in, and where intent either strengthens or falls apart.
The useful question isn’t “how do we compare?”
It’s:
“What does this tell us about where to invest and what needs fixing before we scale ad spend?”
Google Ads: High Intent, Low Completion
Finance and insurance sits at an 8.3% average CTR on Google Search in 2026, comfortably above the cross-industry average of 6.7%.
So demand is there. People are searching. Clicking isn’t the issue.
The conversion rate tells a different story: around 2.5%, versus a cross-industry average closer to 7.5%.
That gap is where most fintech teams get stuck.
The easy conclusion is “landing page problem.” And yes, trust, UX, and clarity matter more here than in most categories.
But that’s only part of it.
Some of that drop-off is:
- early-stage research (not buying intent)
- long sales cycles
- multiple stakeholders needing to align
- “come back later” behaviour that never gets attributed
Fintech decisions rarely happen on the first click. Search captures intent, it doesn’t complete the journey.
What this actually means for investment:
If your Google Ads CVR is sitting below 3%, scaling spend won’t fix it on its own. But equally, not all of that “inefficiency” is waste. Some of it is simply how the category behaves.
The job isn’t just to improve conversion rate. It’s to:
- tighten keyword intent (reduce curiosity clicks)
- improve post-click experience (reduce friction)
- and accept that some value will show up later, elsewhere, or not be tracked at all
The CPL benchmark for finance sits around $84, higher than most industries, and unlikely to drop meaningfully. The win comes from improving what happens after the click, not trying to outbid the market.
Where Google Ads win
Capturing bottom-of-funnel demand. If someone is actively searching for a payments platform, lending solution, or API provider, you need to be there.
Where it struggles
Creating demand. If your ICP doesn’t know to search for you yet, Search can’t help you, at least not on its own.
LinkedIn Ads: Precision Is the Product
LinkedIn’s 2026 benchmarks put average B2B CPL at around $276, with wide variation depending on targeting and segment.
For fintech digital marketing, that variation becomes more pronounced:
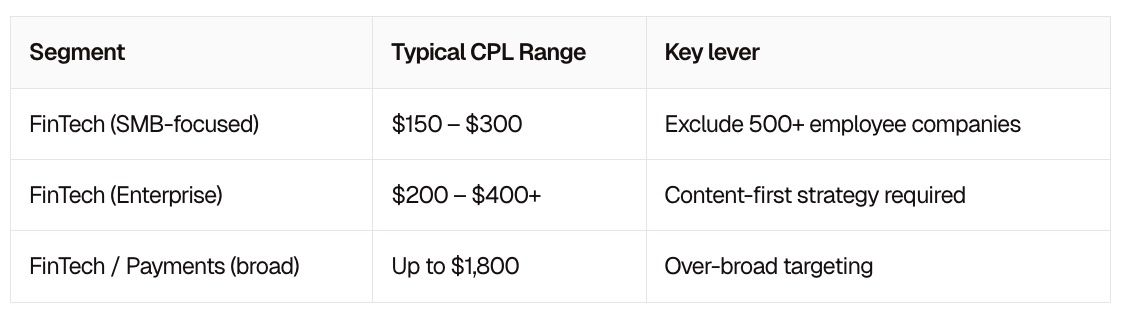
Ok, that last number was for dramatic effect. But your cost per lead going sky high is what happens when campaigns target “finance professionals” as a catch-all audience. Everyone is bidding on the same pool, and the auction reflects it.
The bigger issue isn’t cost. It’s precision.
LinkedIn isn’t a lead gen channel in isolation. It’s a pipeline creation channel for a defined set of buyers.
Used properly, it shapes demand before it ever shows up in Search.
Used poorly, it becomes an expensive way to collect unqualified leads.
The Lead Gen Form trap
On paper, LinkedIn Lead Gen Forms look like a clear win:
- 6–10% conversion rates
- ~25% lower CPL than landing pages
And those numbers are broadly true.
But they come with a trade-off most teams ignore: lead quality often dips.
When friction is reduced, volume increases, but intent doesn’t always follow. Especially in fintech, where trust and consideration matter, some of the highest-quality conversions come after:
- Multiple touchpoints
- Off-platform research
- Revisits via Search or direct traffic
Those journeys are rarely tracked cleanly.
So you end up with a slightly misleading picture:
- Lead Gen Forms look more efficient (lower CPL, higher CVR)
- Landing pages look weaker
- But the eventual revenue may tell a different story
-
What this actually means:
Lead Gen Forms are useful. Particularly for:
- Early-stage engagement
- Warming up cold audiences
- Reducing friction in initial capture
But they shouldn’t be judged, or scaled, in isolation.
If anything, the strongest fintech pipelines tend to come from a mix of:
- On-platform capture (for ease)
- Off-platform conversion (for intent)
- and multiple touches across channels before either happens
-
The targeting fix most teams ignore
If you’re selling into SMB fintech:
Exclude companies with 500+ employees.
It’s a simple change that can reduce CPL by 60–70%, because you stop competing in the enterprise auction.
Yet most campaigns leave this wide open and unknowingly absorb the cost.
Where LinkedIn wins
Reaching the right people at the right companies before they’re actively searching.
Where it breaks
When targeting is too broad, or when lead volume is prioritised over lead quality.
Paid Social: The Channel That Makes the Others Work
Paid social is rarely benchmarked properly in fintech because averages are almost meaningless.
Performance varies too much based on:
- product type (consumer vs B2B)
- funnel stage
- creative quality
- audience maturity
But a few patterns are consistent:
- Consumer fintech can achieve £15–£40 CPL on Meta with strong creative and lookalikes
- B2B fintech struggles to generate qualified leads directly due to weaker targeting
- CPCs have risen across most industries, driven by competition and automation
The mistake isn’t that teams use paid social.
It’s that they expect it to behave like LinkedIn or Search.
What paid social is actually good at
- Accelerating consideration, not just awareness
- Building and refreshing retargeting pools
- Testing messaging at scale before pushing into higher-cost channels
In other words:
Paid social rarely creates demand on its own in B2B fintech. But it often makes your other channels work better.
Treating Meta as a like-for-like replacement for LinkedIn in lead generation is where budgets tend to disappear quietly.
So Where Should You Actually Invest?
Benchmarks don’t give you an answer. They give you signals.
The decision is how you respond to them.
If your product has clear search intent
Start with Google Ads. Demand exists. The challenge is converting it and understanding that not all of that value will show up neatly in-platform.
If you’re targeting a defined set of companies or decision-makers
LinkedIn is non-negotiable. But only if you’re willing to:
- narrow your targeting properly
- invest in genuinely useful content
- and accept that not every meaningful interaction will convert immediately (or be tracked)
-
If you’re running product-led growth or consumer fintech
Paid social can drive volume efficiently, but only if creative is strong and refreshed often.
If you’re doing all three well
That’s where things start to compound:
- Search captures intent
- LinkedIn shapes it
- Paid social keeps you visible between the two
-
The part most teams get wrong
Most fintech teams don’t have a channel problem.
They have an allocation problem.
Too much budget goes into generating new demand, not enough into capturing the demand that already exists or nurturing it properly once it’s there.
And too many decisions are made on surface-level metrics like CPL and CVR, without accounting for:
- lead quality
- multi-touch journeys
- and the conversions that never get attributed at all
-
The takeaway
Benchmarks are useful. But only if you treat them as context, not targets.
They don’t tell you what “good” looks like for your business.
They tell you where friction sits in a channel, and where your strategy needs to do more of the work.
If you’re looking at your current channel mix and something feels off, it probably is. Not because the numbers are wrong, but because they’re being read too literally.
That’s usually where the opportunity sits.