

Most LinkedIn Ads audits start the same way.
Someone pulls up their campaign dashboard, sees a 0.40% CTR and a £100 CPL, and decides the campaign is failing. They pause it. They rebuild it. They try a different creative. The numbers barely move.
The problem usually isn't the campaign. It's the benchmark.
Yes, the global average CTR on LinkedIn Sponsored Content sits at around 0.4–0.6%. But that number is almost meaningless in isolation. A SaaS company targeting VP-level decision-makers in EMEA is playing an entirely different game to a retail brand running awareness ads to a broad audience. Lumping them into the same benchmark is like comparing a Formula 1 lap time to a Sunday drive and calling one of them slow.
Here's what the 2026 data actually shows, broken down by the dimensions that matter.
CTR, CPC & CPL Benchmarks by Industry
The variance across industries is significant enough to completely change how you should interpret your results. SaaS campaigns routinely underperform on CTR because the audience (senior technical buyers) is harder to engage with generic content. Retail and consumer goods skew high because the audience is broader and more scroll-responsive.
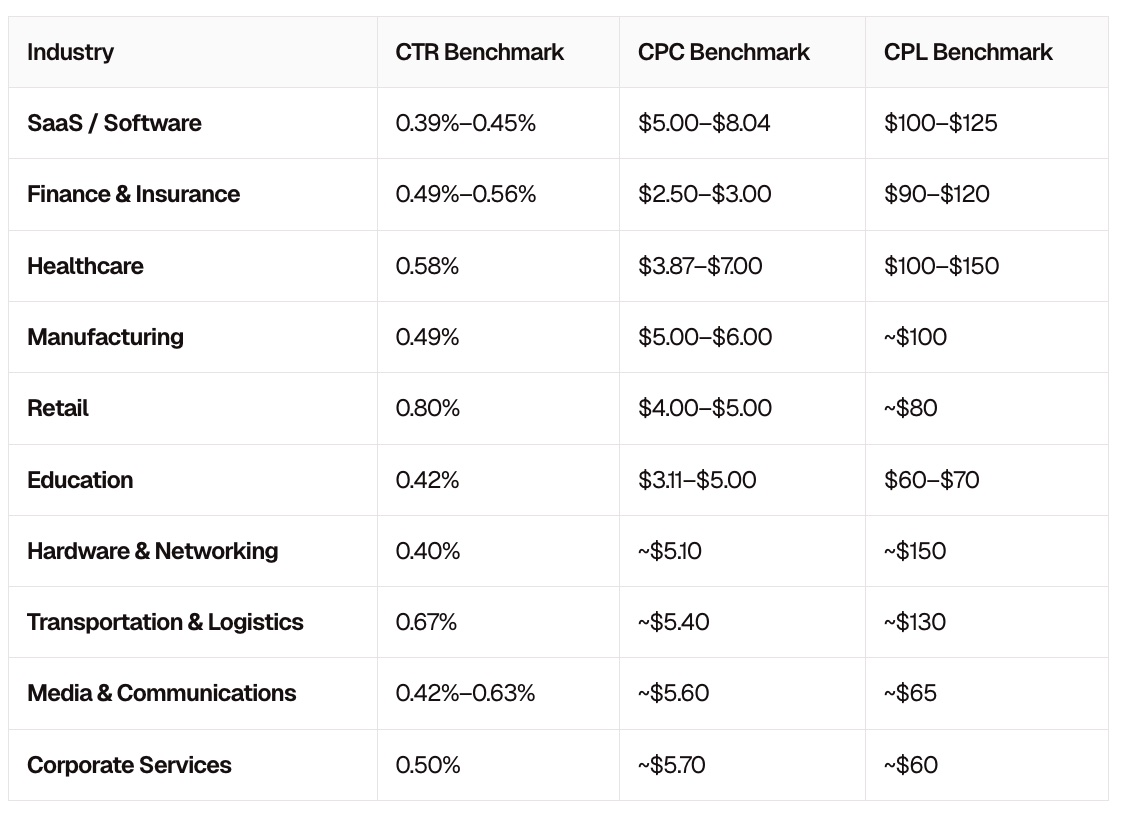
Sources: *Closely HQ, The B2B House
The SaaS paradox: the industry with the lowest CTR (0.39%) also carries the highest CPC (up to $8.04). You're paying more per click for an audience that's harder to engage. That's not a reason to abandon LinkedIn; it's a reason to be far more precise about your creative and offer.
The Education and Corporate Services opportunity: both show CPLs in the $60–$70 range, well below the platform average of $128. If you're in either space and your CPL is north of £100, something structural is wrong with your targeting or offer.
Seniority and Job Function Change Everything
If you're targeting senior decision-makers (VPs, Directors, C-suite), expect to pay a premium on every metric. That's not a flaw in your campaign; it's the cost of reaching the people who actually sign off on budgets.
- Senior decision-makers: CTR 0.55%, CPC ~$6.40
- Junior employees: CTR 0.60%, CPC ~$4.40
Junior audiences click more and cost less. But for most B2B products, they're not the buyer. Optimising for CTR by shifting to junior targeting is one of the most common ways B2B campaigns inflate their click numbers while generating zero pipeline.
The job function data adds another layer. IT decision-makers cost $7.90 per click. Product Managers hit $7.30. Finance buyers sit at $6.90. If you're targeting any of these functions and your CPC looks "high" against a generic benchmark, it isn't. It's exactly where it should be.
The real mistake isn't paying $7–8 per click. It's paying $7–8 per click for an audience that isn't qualified, because the targeting was too broad.
Ad Format Benchmarks: The Numbers Most Reports Bury
Format choice has a bigger impact on CTR than most advertisers realise. Here's the 2026 breakdown for Sponsored Content:
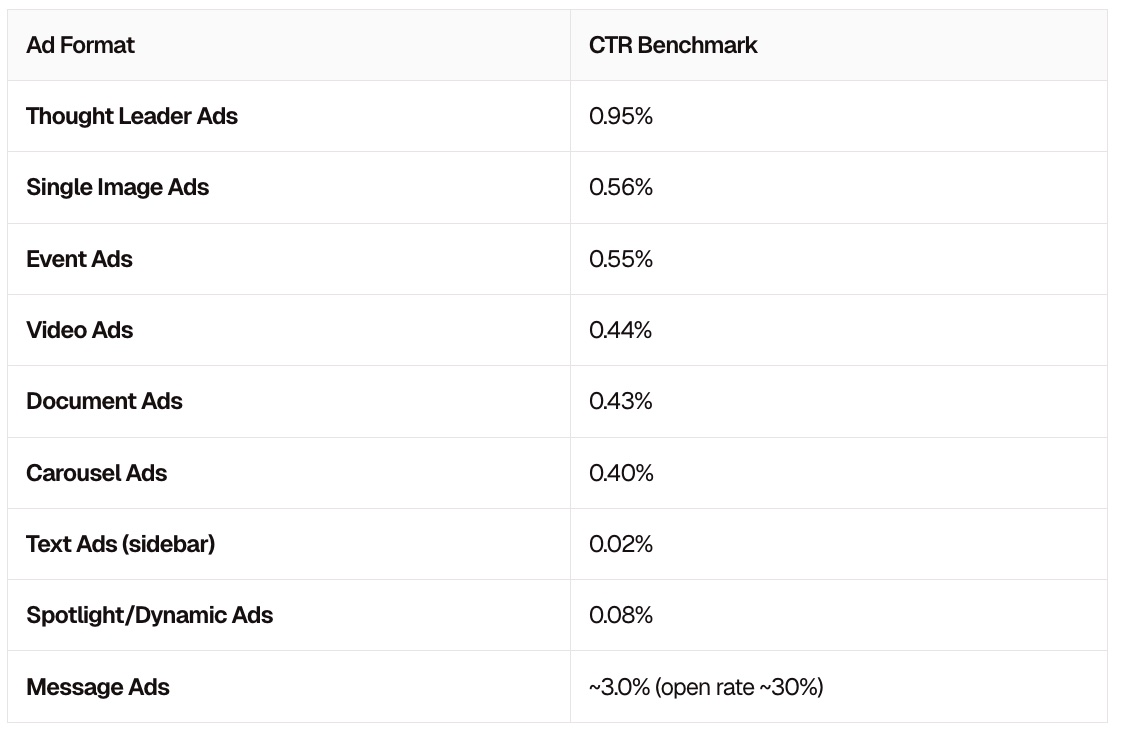
Source: ZenABM
A few things worth noting here.
Thought Leader Ads are the outlier. At 0.95% CTR, they nearly double the next best format. They work because they look like organic posts from real people, not ads. If you're not testing them, you're leaving the highest-performing format on the table.
Carousel Ads consistently underperform. Despite being a popular format choice, they sit at the bottom of the Sponsored Content range. They require more creative effort and deliver lower engagement. The data doesn't support defaulting to them.
Message Ads operate on a different logic entirely. A 3% CTR sounds exceptional, but it's measured against opens, not impressions. With a 30% open rate, the effective engagement rate on sends is closer to 0.9%. Still strong, but not the outlier it appears.
So What Should You Actually Benchmark Against?
Before you judge your campaign performance, run through this checklist:
- Industry first. Are you comparing your CTR to your industry benchmark, not the global average? A 0.42% CTR in SaaS is above the industry norm. A 0.42% CTR in Retail is a problem.
- Seniority second. Are you targeting Director-level and above? Add a premium to every CPC expectation. $6–8 per click is normal. Below $4 for senior audiences usually means your targeting has drifted.
- Format third. If you're running Carousel Ads and wondering why CTR is low, the format is partly responsible. Test Single Image or Thought Leader formats before assuming the creative is the issue.
- Region fourth. EMEA campaigns (where Lever Digital's clients predominantly operate) typically see CTRs of around 0.6% and CPCs in the mid-range. North American benchmarks, which dominate most published reports, run 40–50% higher on cost. Don't benchmark a UK campaign against a US dataset.
- Measure at company level, not contact level. If you're running multi-touch B2B campaigns, individual click and CPL metrics will always look worse than they are. The question is: which companies are engaging, and are they converting to pipeline?
The campaigns that get paused too early are almost always the ones being measured against the wrong number. Check your benchmark before you change your campaign.