Use this banner section for site-wide announcements, news updates, big changes and more.

Most B2B marketing teams have an ICP document. It lives in a shared drive, describes an idealised buyer in broad strokes, and gets referenced occasionally in campaign briefs. It doesn't score anything. It doesn't exclude anyone. And it doesn't feed your ad algorithms.
That's the gap this guide addresses.
ICP scoring is the operational layer that turns a static profile into a live, weighted model. It tells you precisely which accounts are worth your budget, which signals predict a good fit, and which prospects look promising but will never convert. Done properly, it reduces wasted spend, sharpens targeting, and gives your sales team a shared language for prioritisation.
What this guide covers:
If you already have an ICP scoring framework and want to apply it directly to paid campaigns, the Lever Digital guide to ICP scoring for paid media covers that in detail. This guide is the foundation that makes that application work.
These two terms get used interchangeably. They shouldn't. They answer completely different questions, and confusing them is one of the most common reasons B2B paid campaigns underperform.
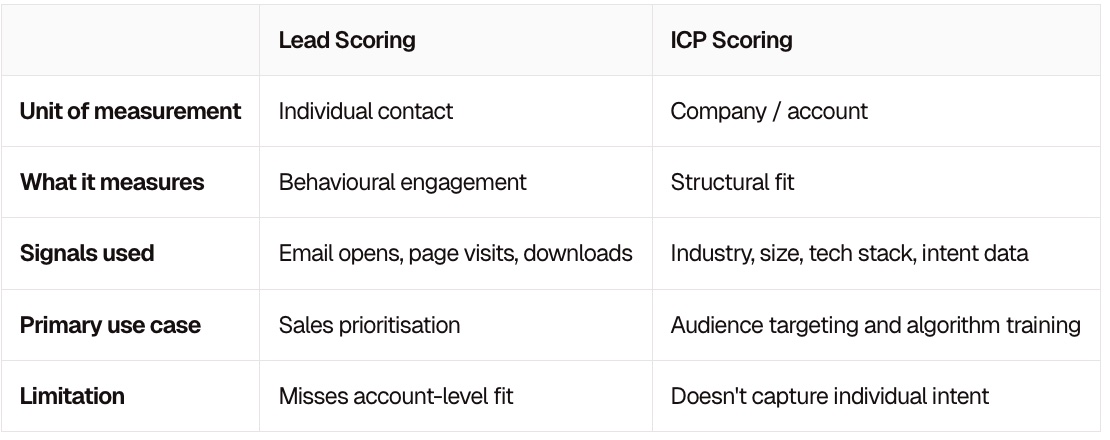
The core problem with relying on lead scoring alone: a marketing manager at a 12-person startup can score 90/100 on engagement. They opened every email, downloaded your pricing guide, visited your demo page three times. They will never buy. Their company is simply not a fit. ICP scoring flags the account before that contact ever engages, saving both ad spend and sales time.
The reverse is also true. A CFO at a 400-person SaaS company attends one webinar and submits a demo request. Low engagement score. But their company is a near-perfect ICP match. Lead scoring deprioritises them. ICP scoring flags them as Tier 1.
Use ICP scoring first to qualify accounts. Then layer lead scoring on top to prioritise which contacts within those qualified accounts to engage. An MQL should require both: account-level fit and individual-level intent. Teams that apply this two-layer model consistently report higher MQL-to-SQL conversion rates, because every lead that reaches sales is both structurally qualified and showing genuine buying signals.
Most ICP scoring models stop at firmographics. That's a starting point, not a complete model. A robust framework scores accounts across five dimensions, each capturing a different layer of fit.
The baseline. These are the structural characteristics of a company that correlate with whether they can buy your product.
Firmographic data is widely available through LinkedIn, CRM enrichment tools, and intent data platforms. It's also the dimension most commonly over-weighted. Industry and size matter, but they rarely tell the whole story on their own.
What technology a company already uses reveals budget, sophistication, and compatibility with your solution.
Technographic data is available through tools like Clearbit, Bombora, and Apollo. It's underused by most B2B marketing teams, which makes it a genuine competitive advantage when you build it into your scoring model.
This is where ICP scoring and lead scoring begin to overlap, but at the account level rather than the contact level.
Multi-contact engagement from the same account is a particularly strong signal. In B2B buying committees of six to ten people, seeing two or three contacts from the same company engaging independently often precedes a serious evaluation.
Third-party intent data tracks which companies are actively researching topics related to your solution, even before they visit your site. Platforms like Bombora and G2 Buyer Intent surface accounts that are surging on relevant keywords across the wider web.
Intent data is best used as a score multiplier rather than a standalone dimension. An account that scores well on firmographic and technographic fit, and is also showing intent signals, moves to the top of your priority list immediately.
This is the dimension most teams skip, and it's the most important one for cleaning up wasted spend.
Negative scoring assigns penalty points to accounts that exhibit characteristics correlated with churn, non-conversion, or poor fit, regardless of how well they score on positive dimensions.
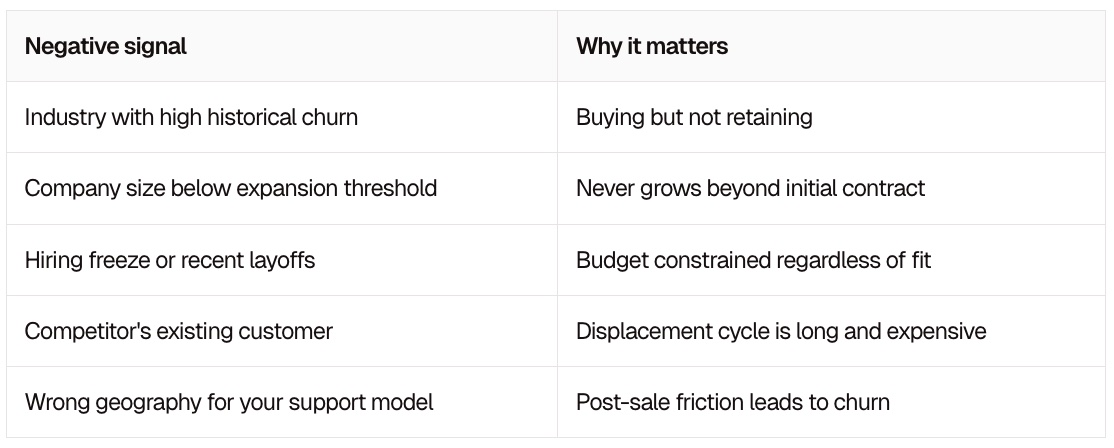
A company that scores 35/40 on positive dimensions but triggers two negative indicators should be downgraded to Tier 2 or excluded from Tier 1 budget entirely. Without negative scoring, your model is optimistic by design.
Building the five dimensions is the easy part. Weighting them correctly is where most teams go wrong, and the only way to get it right is to work backwards from your actual deal data.
Export from your CRM and map each deal against your five dimensions. You're looking for which attributes appear consistently across your best deals (highest ACV, fastest close, lowest churn). Those attributes earn higher weights.
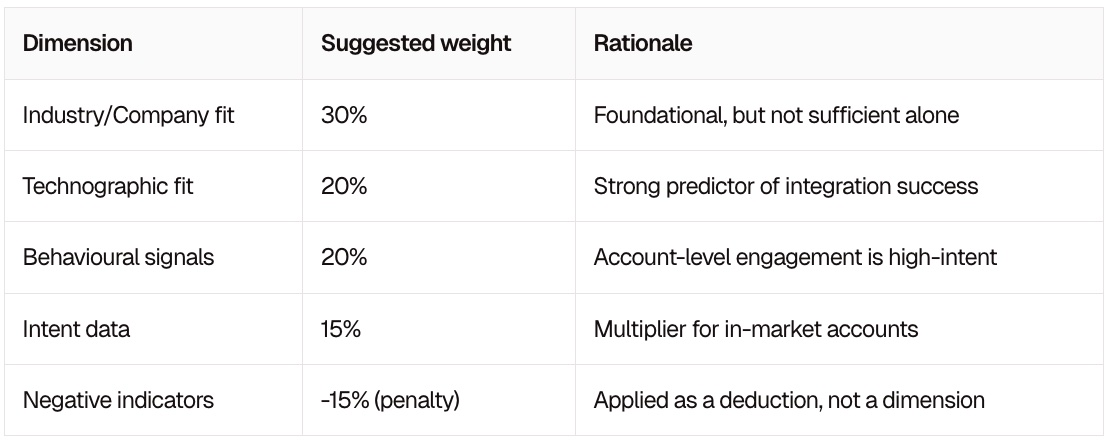
These are starting weights. Your data will tell you if industry is more predictive than tech stack, or if intent data alone is a stronger signal than behavioural engagement. The point is to let closed-won patterns drive the weighting, not assumptions.
This is the step most teams skip, and it's critical. Pull your last 50 closed-lost deals and score them using your model. If your closed-lost deals score similarly to your closed-won deals, your model is missing a differentiating dimension.
If closed-won and closed-lost look the same on paper, your ICP is not specific enough.
Common causes: the model is too firmographic-heavy (everyone in the right industry looks the same), or it's missing a technographic or organisational signal that separates buyers from non-buyers. Add a dimension until the two populations look meaningfully different.
Once your model is validated, translate scores into actionable tiers:
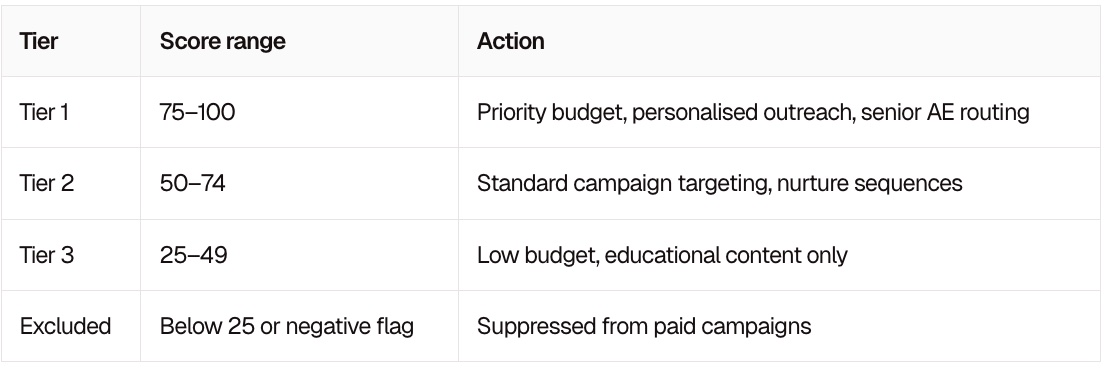
The exclusion list is as valuable as the Tier 1 list. Suppressing low-fit accounts from your paid campaigns directly reduces wasted spend and improves the quality signal you send to ad algorithms. Platforms like Google Ads and LinkedIn use conversion data to find more accounts like the ones that converted. If you're feeding them low-fit conversions, they'll find more low-fit accounts.
A scoring model that lives in a spreadsheet is just a better slide deck. The value comes from connecting scores to the systems that drive spend and outreach.
Google's Smart Bidding algorithm optimises towards the conversion events you feed it. If every form submission is treated as an equal conversion, the algorithm learns to find more people who fill in forms, regardless of fit.
The fix is tiered offline conversion values:
This tells Google's algorithm that Tier 1 conversions are worth more, and it will bias its bidding towards finding more accounts that match that profile. Over time, this compounds: better signals produce better targeting, which produces better signals. For a full walkthrough of how to apply this to your campaigns, see our guide to ICP scoring for paid campaigns.
LinkedIn's firmographic targeting is the most direct application of ICP scoring. Build matched audiences from your Tier 1 account list and use LinkedIn's company targeting to layer in size, industry, and seniority filters that reflect your scoring criteria.
Equally important: use your exclusion list. Upload low-fit accounts as a suppression audience. This prevents budget from reaching companies you've already identified as poor fits, even if they match your surface-level targeting criteria.
ICP scores should live in your CRM as a field on the account record, not in a separate spreadsheet. When a new lead comes in, your CRM should automatically:
This removes manual triage from your sales team's workflow and ensures your best leads get the fastest response. It also connects your channel prioritisation strategy directly to the accounts most likely to deliver high LTV.
An ICP scoring model is not a one-time build. Markets shift, your product evolves, and the customers who churned last year can tell you as much as the ones who expanded.
Review your model when any of the following occur:
A good ICP scoring model should feel slightly uncomfortable to update. If it's easy to add every new segment that converts, you're not scoring, you're describing. The model's value comes from its exclusions, not just its inclusions.
The practical cadence for most B2B teams: a light quarterly review of closed-won data, and a full model rebuild annually or after a significant product or market change.
ICP scoring is not a marketing exercise. It is a revenue infrastructure decision. The teams that build it properly stop optimising for lead volume and start optimising for pipeline quality, and the downstream effects show up in win rates, sales cycle length, and customer LTV.
The framework in this guide gives you the foundation:
Coming soon: an interactive ICP scoring calculator to help you build and weight your model in minutes.
If you want to build and activate an ICP scoring model for your B2B paid campaigns now, get a free proposal from Lever Digital. We work with SaaS and FinTech teams to connect ICP scoring directly to paid media performance.

Lever Digital is proud to be a 2026 UK Paid Media Awards finalist, recognised for outstanding performance-led paid media campaigns across B2B and SaaS.

.png)